Report Types
When creating a report, choose how the data is scoped and who receives it.
For Manager and Agent reports, you design the report layout once and preview it with any individual’s data while building. When you publish, the same layout is generated for every manager or agent — only the underlying data changes.
Reports List
Click Reports in the left navigation to see all reports. The list shows each report’s name, status, type, products, who created it, and when.Finding and organizing reports
Finding and organizing reports
- Search by report name using the search bar.
- Filter by status (Draft, Published), report type (Admin, Manager, Agent), or product.
- Sort by clicking any column header.
- Status badges indicate where each report stands: Draft (gray), Published (green), or Generating (yellow — in progress).
Managers and agents are automatically directed to My Reports, which shows only reports shared with them. See Viewing Published Reports.
Create a Report
1
Navigate to Reports
Click Reports in the left navigation bar, then click Create new report in the top right.
2
Configure scope
Set a name, report type (Admin, Manager, or Agent), date range, duration, product, and call type (Training or Live).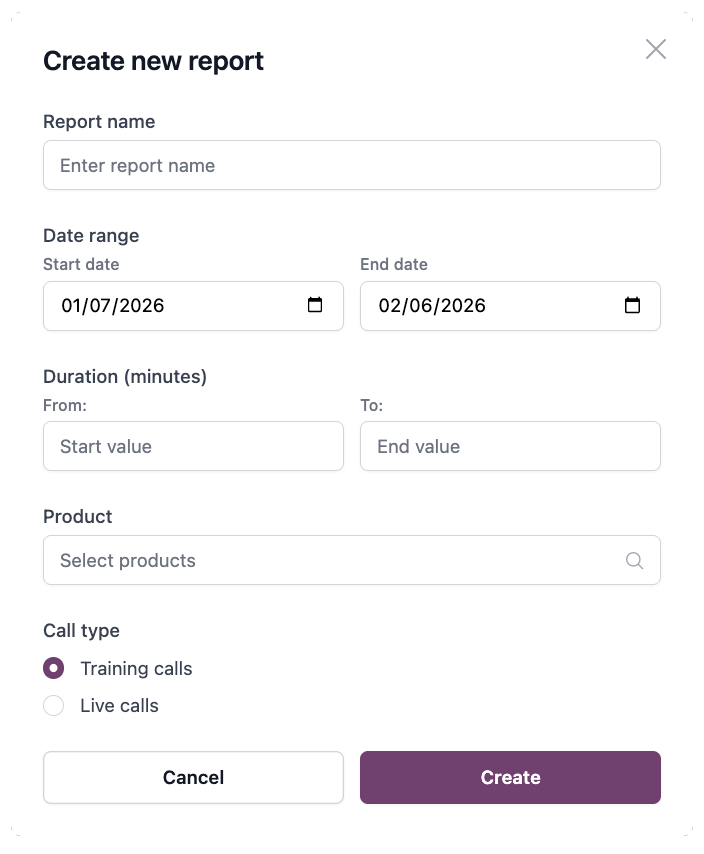
3
Open report builder
Click Create to open the report builder. For Manager or Agent reports, you will first select a person to preview how the report looks with their data while you build it. You can switch between people at any time to check how the layout looks with different data — this does not affect the final output, which is generated for everyone when you publish.
Report Builder
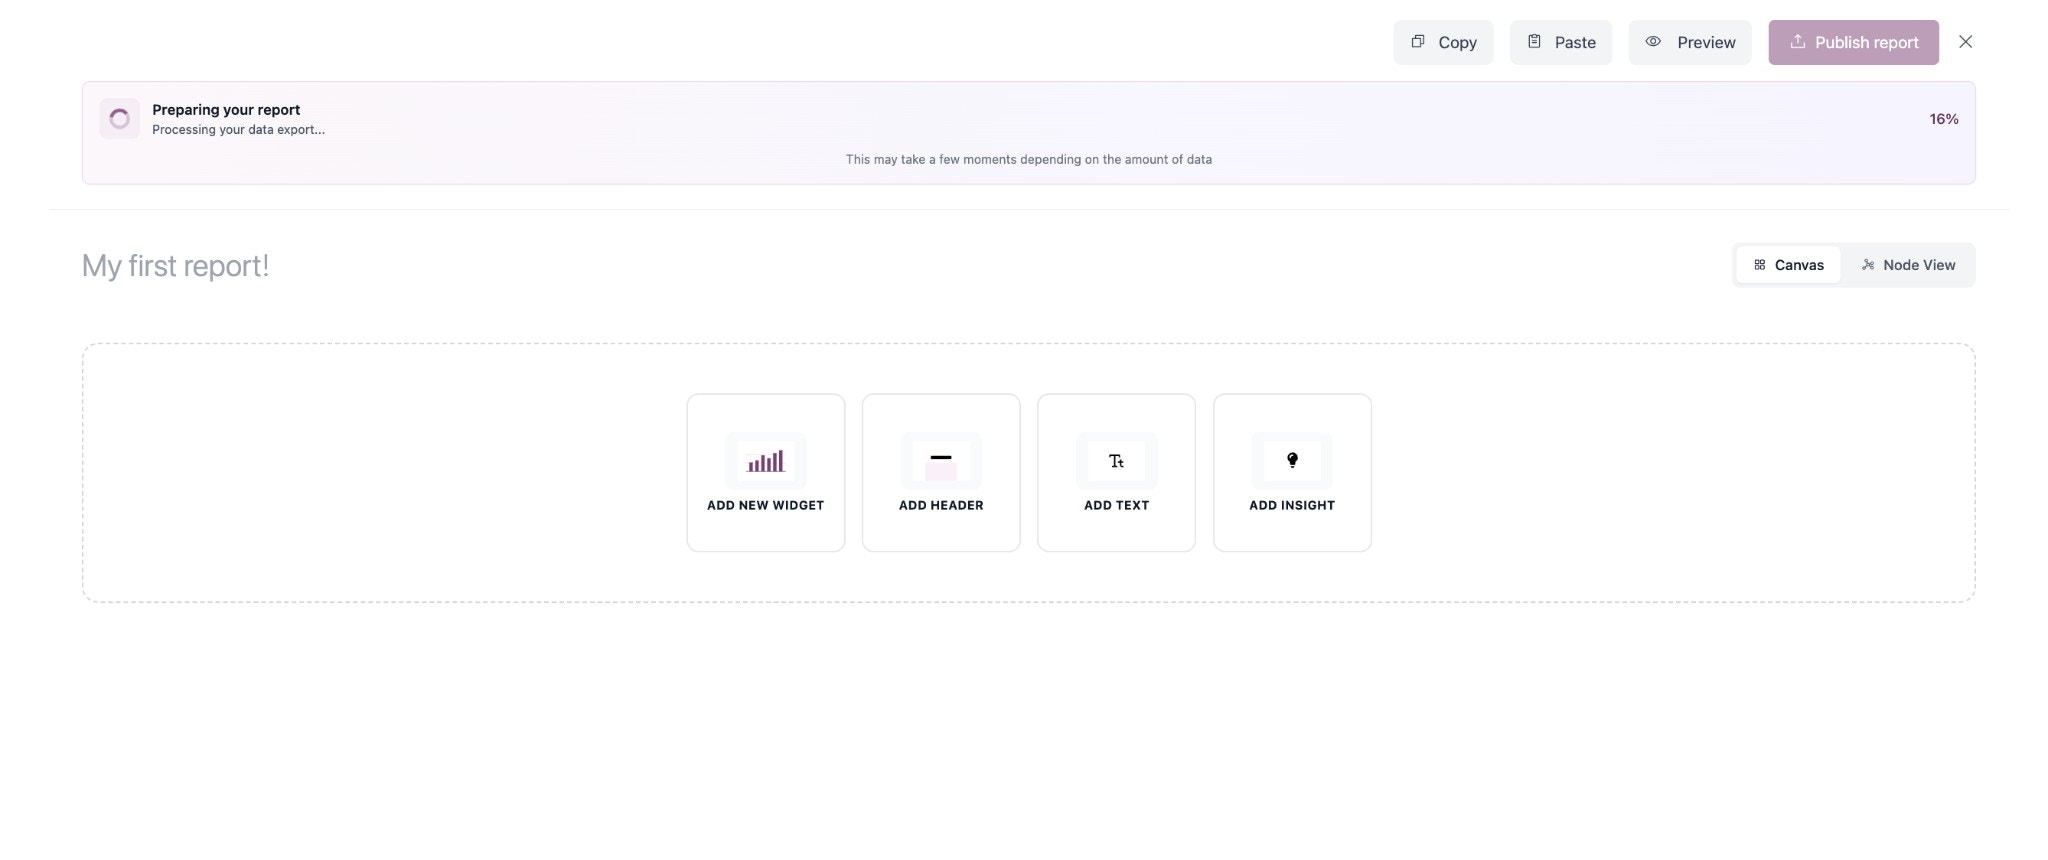
Adding and editing sections
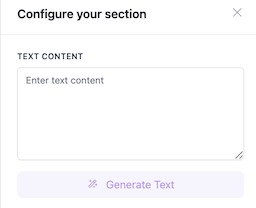
Add sections to your report using the toolbar buttons: Widget, Header, Text, or Insight. Click any section on the canvas to configure it in the right panel. You can drag sections to reposition them and drag their edges to resize.- Widgets
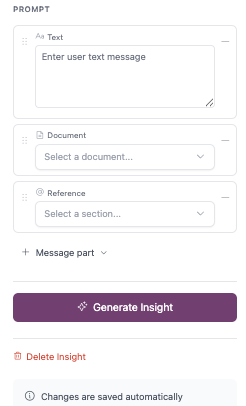
- Insights
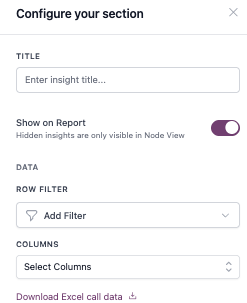
- Headers & Text
Widgets are data visualizations tied to metrics. Select a metric, choose a chart type, and optionally break down or filter the data.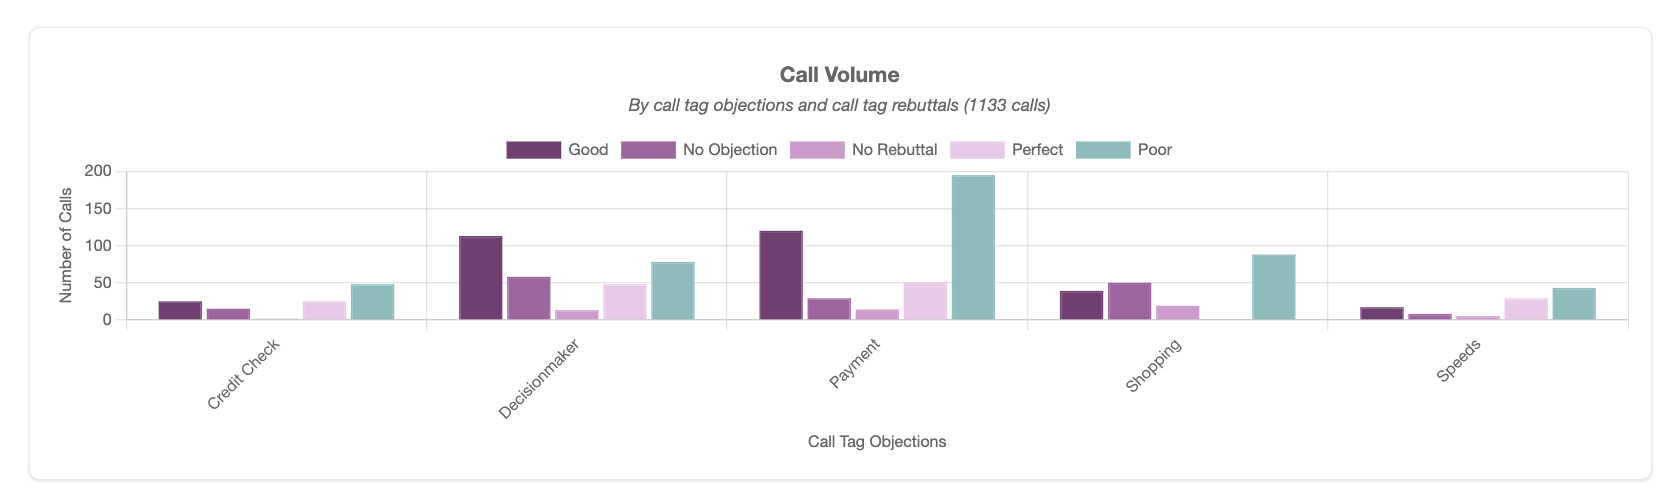
Widget titles and captions: Click a widget’s title on the canvas to edit it inline. Below each widget, click “Add caption…” to add a short description that appears at the bottom of the visualization.
Step-by-step: Configure your widget
Step-by-step: Configure your widget
Configure the following fields in the right panel to generate the data visualization.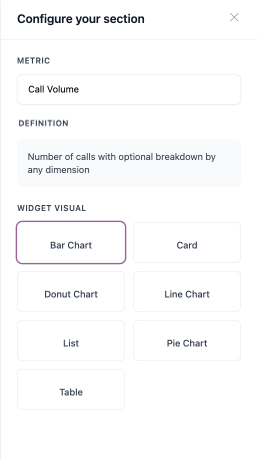
1
Metric
Choose from your organization’s available metrics (e.g., Call Volume, Average Handle Time, Compliance Score). A description of the selected metric appears below the dropdown to explain what it measures.
Contact your Customer Success Manager to request custom metrics for your organization.
2
Chart type
Select a chart type to display the data.
Chart type options
Chart type options
Bar charts support a horizontal bars toggle when you want bars displayed left-to-right instead of bottom-to-top.
3
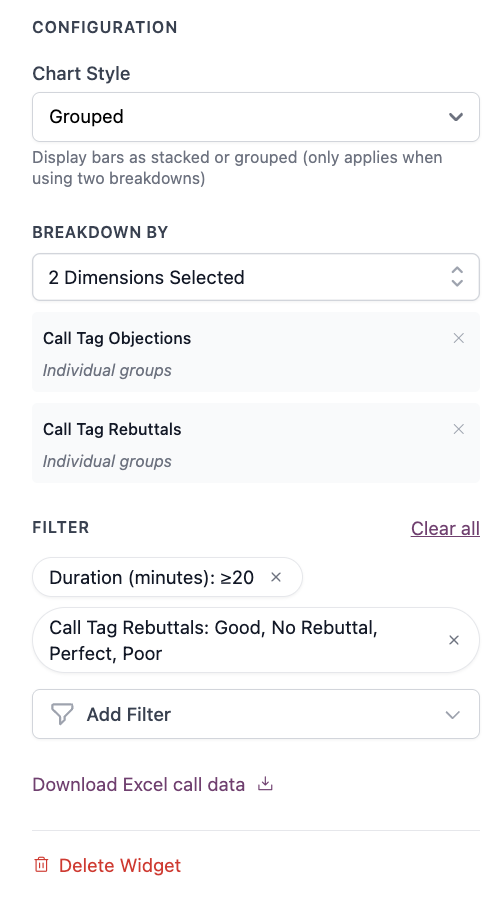
Breakdown
Choose up to 2 dimensions (e.g., agent, product, tags, date, score range, duration range) to segment data. The first dimension defines the main axis; the second creates grouped or stacked segments within each group.Example: The chart and config screenshots above show Objection type (Dimension 1) on the axis and Rebuttal quality (Dimension 2) as segments. This displays call volume by objection, broken down by rebuttal quality.Date breakdowns support configurable intervals: daily, weekly, monthly, or yearly.
For bar charts with two dimensions selected, you can display data either grouped (bars side-by-side) or stacked (segments stacked on top of each other).
4
Filter
Optional widget-specific filters to narrow data within your report scope.
5
Target (optional)
Set a target value or range to display a benchmark line on your chart. Choose between a single target value or a min/max range.
Preview mode
For Admin reports, use the Preview / Edit toggle to switch between building your report and seeing a read-only preview of how it will look when published. For Manager and Agent reports, use the employee switcher dropdown to preview how the report looks with different people’s data.Report name
Click the report name at the top of the canvas to rename it inline.Publishing and Sharing
Publishing
When your report is ready, click Publish in the report builder toolbar.- Admin Reports
- Manager & Agent Reports
Admin reports publish immediately.
To make changes after publishing, click Unpublish to revert the report to draft. The report will no longer be visible to viewers until you publish again.
Sharing
- Copy link: From the reports list, click the ellipsis menu on any report and select Copy link to copy a direct link to the report.
- Share a specific version: For published Manager and Agent reports, each version has a Share button that opens a dialog with a link to that person’s report. Copy and send the link — recipients must be logged in to view it.
Viewing Published Reports
- Admin Reports
- Manager & Agent Reports (admin view)
- My Reports (manager & agent view)
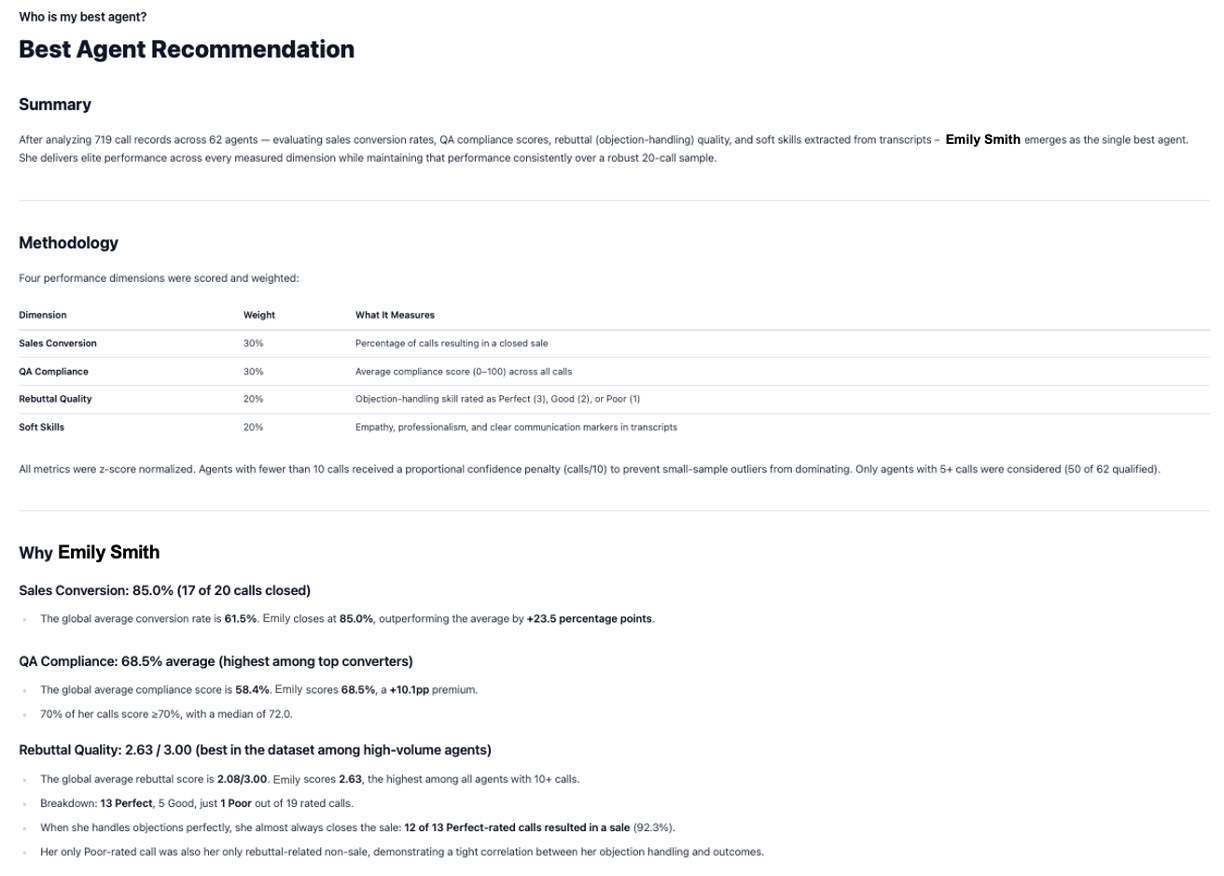
Click a published Admin report in the reports list to view it. The report opens as a standalone page with interactive charts and formatted insight content.
Exporting Data
Excel exports run in the background. A progress indicator appears while the file is being prepared, and the download starts automatically when ready.
FAQ
Who can see my reports?
Who can see my reports?
It depends on the report type. Admin reports are visible only to admins. Manager and Agent reports are distributed automatically — each person sees only their own version under My Reports. Admins can always view all versions.
How do I give my team their own reports?
How do I give my team their own reports?
Choose the Manager or Agent report type when creating your report. You design the layout once, and when you publish, each manager or agent receives their own version with their data. They can view it under My Reports in the left navigation.
Can I edit a report after publishing it?
Can I edit a report after publishing it?
Yes. Unpublish the report to revert it to draft, make your changes, then publish again. While unpublished, the report is not visible to viewers.
Can I combine training and live performance in one report?
Can I combine training and live performance in one report?
Not in a single report — each report covers either Training or Live calls. Create two separate reports to analyze both.
Can I reuse a report layout for different date ranges or teams?
Can I reuse a report layout for different date ranges or teams?
Yes. Click the ellipsis menu next to any report in the reports list and select Duplicate. This creates a copy with the same layout and sections that you can reconfigure with a different date range, product, or report type.
What metrics are available?
What metrics are available?
Your organization has a set of pre-configured metrics (e.g., Call Volume, Average Handle Time, Compliance Score). Contact your Customer Success Manager to request additional custom metrics. See the Metrics Glossary for how each metric is calculated.
Additional Resources
Add Call Metadata
Add custom tags via API for filtering and breakdowns.
Metrics Glossary
How each metric is calculated.