> ## Documentation Index
> Fetch the complete documentation index at: https://docs.reddy.io/llms.txt
> Use this file to discover all available pages before exploring further.
# Building Reports
> Build reports to analyze agent performance, identify trends, and extract insights from your call data.
## Report Types
When creating a report, choose how the data is scoped and who receives it.
| Type | What it does |
| ----------- | ---------------------------------------------------------------------------------------------------------------------------------------- |
| **Admin** | One consolidated report covering all agents. Shared with admins only. |
| **Manager** | Generates a separate report for each manager, automatically scoped to their direct reports' data. Each manager sees only their own team. |
| **Agent** | Generates a separate report for each agent, automatically scoped to that agent's own data. Each agent sees only their own performance. |
For Manager and Agent reports, you design the report layout once and preview it with any individual's data while building. When you publish, the same layout is generated for every manager or agent -- only the underlying data changes.
## Reports List
Click **Reports** in the left navigation to see all reports. The list shows each report's name, status, type, products, who created it, and when.
* **Search** by report name using the search bar.
* **Filter** by status (Draft, Published), report type (Admin, Manager, Agent), or product.
* **Sort** by clicking any column header.
* **Status badges** indicate where each report stands: Draft (gray), Published (green), or Generating (yellow -- in progress).
**Actions per report:** Click the ellipsis menu next to any report to Copy link, Edit, Duplicate, or Delete.
Managers and agents are automatically directed to **My Reports**, which shows only reports shared with them. See [Viewing Published Reports](#viewing-published-reports).
## Create a Report
Click **Reports** in the left navigation bar, then click **Create new report** in the top right.
Set a name, report type (Admin, Manager, or Agent), date range, duration, product, and call type (Training or Live).
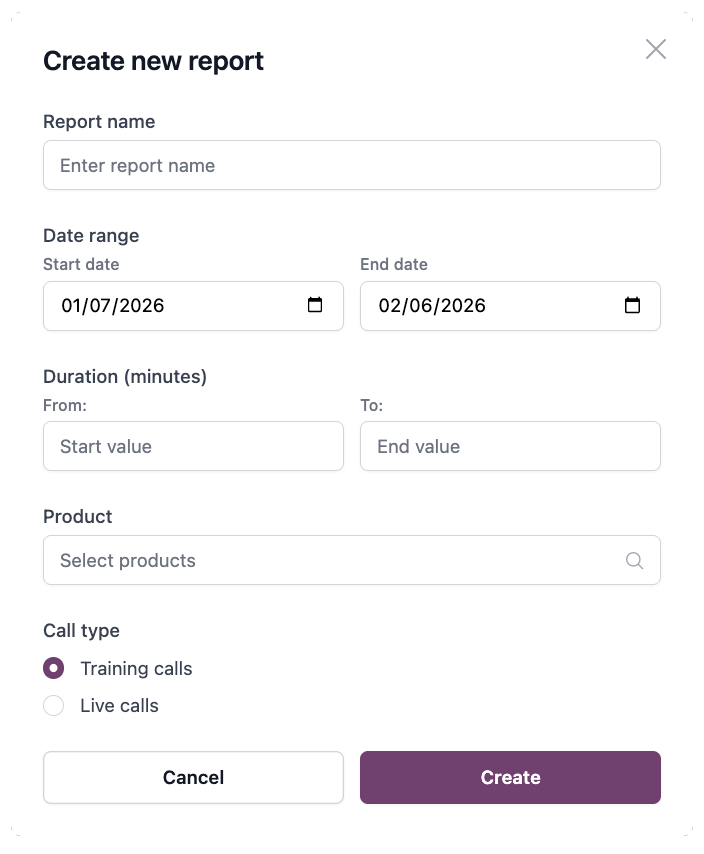 Naming best practice: `LineOfBusiness -- UseCase -- DateRange` (e.g., "Sales -- Weekly Compliance -- Q1 2026").
The report scope (date range, products, call type, duration) cannot be changed after creation. To use different settings, duplicate the report and adjust the scope on the new copy.
Click **Create** to open the report builder. For Manager or Agent reports, you will first select a person to preview how the report looks with their data while you build it. You can switch between people at any time to check how the layout looks with different data -- this does not affect the final output, which is generated for everyone when you publish.
## Report Builder
Naming best practice: `LineOfBusiness -- UseCase -- DateRange` (e.g., "Sales -- Weekly Compliance -- Q1 2026").
The report scope (date range, products, call type, duration) cannot be changed after creation. To use different settings, duplicate the report and adjust the scope on the new copy.
Click **Create** to open the report builder. For Manager or Agent reports, you will first select a person to preview how the report looks with their data while you build it. You can switch between people at any time to check how the layout looks with different data -- this does not affect the final output, which is generated for everyone when you publish.
## Report Builder
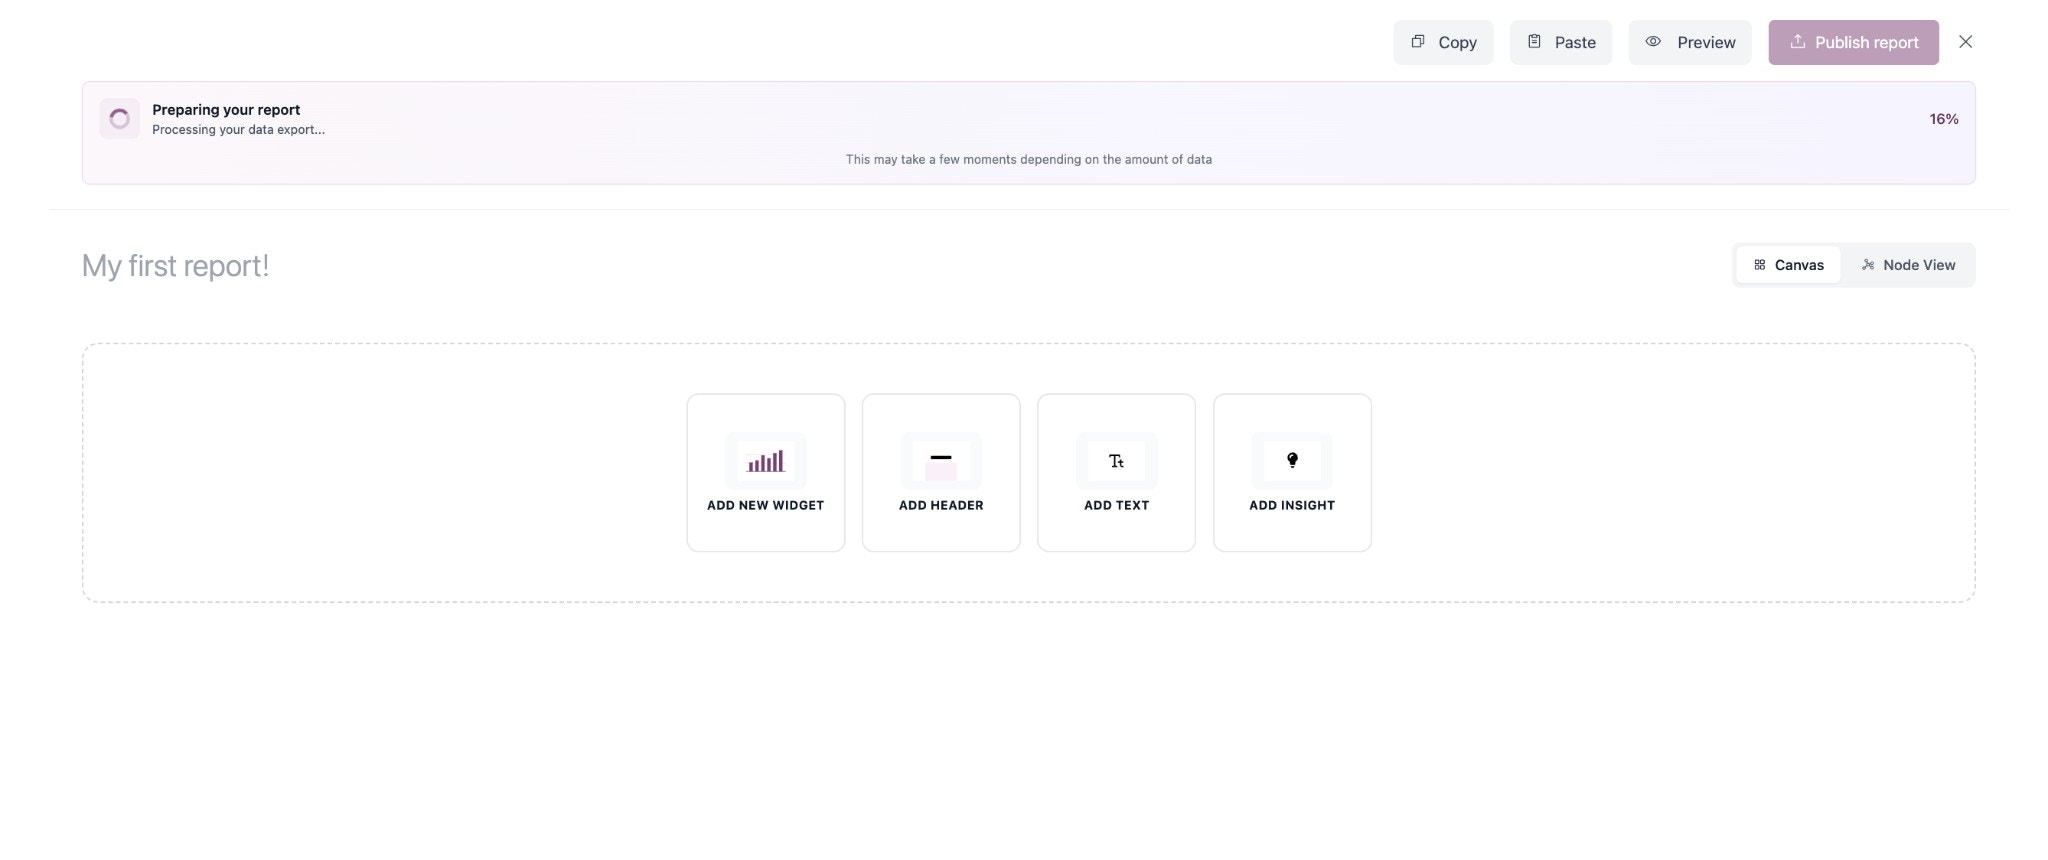 The report builder is a drag-and-drop canvas where you add and arrange content sections. A summary bar below the report name shows the report's products, date range, call type, and duration for reference.
All changes are saved automatically as you work.
### Adding and editing sections
Add sections to your report using the toolbar buttons: Widget, Header, Text, or Insight. Click any section on the canvas to configure it in the right panel. You can drag sections to reposition them and drag their edges to resize.
Widgets are data visualizations tied to metrics. Select a metric, choose a chart type, and optionally break down or filter the data.
The report builder is a drag-and-drop canvas where you add and arrange content sections. A summary bar below the report name shows the report's products, date range, call type, and duration for reference.
All changes are saved automatically as you work.
### Adding and editing sections
Add sections to your report using the toolbar buttons: Widget, Header, Text, or Insight. Click any section on the canvas to configure it in the right panel. You can drag sections to reposition them and drag their edges to resize.
Widgets are data visualizations tied to metrics. Select a metric, choose a chart type, and optionally break down or filter the data.
 Configure the following fields in the right panel to generate the data visualization.
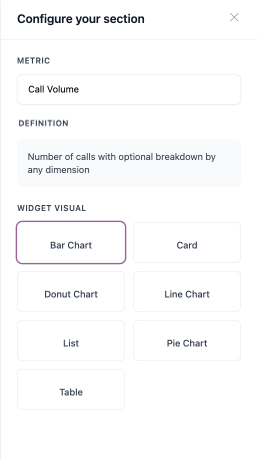
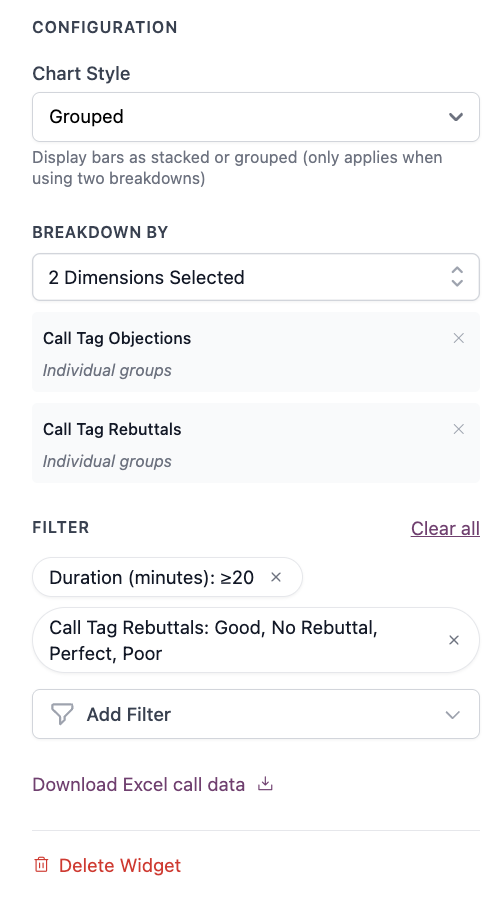 Choose from your organization's available metrics (e.g., Call Volume, Average Handle Time, Compliance Score). A description of the selected metric appears below the dropdown to explain what it measures.
Contact your Customer Success Manager to request custom metrics for your organization.
Select a chart type to display the data.
| Chart Type | Best For |
| --------------- | -------------------------------------------------------------------------- |
| Bar Chart | Comparing categories side-by-side |
| Bar Chart Set | Multiple bar charts in a row for comparing the same metric across segments |
| Line Chart | Showing trends over time |
| Area Chart | Showing trends over time with filled regions |
| Card | Highlighting a single key metric |
| Card Set | Displaying multiple key metrics side-by-side |
| Donut/Pie Chart | Displaying proportions of a whole |
| Pie Chart Set | Multiple pie charts in a row for comparing distributions across segments |
| Table | Detailed data with multiple columns |
| List | Ranked items or top performers |
Bar charts support a **horizontal bars** toggle when you want bars displayed left-to-right instead of bottom-to-top.
Choose up to 2 dimensions (e.g., agent, product, tags, date, score range, duration range) to segment data. The first dimension defines the main axis; the second creates grouped or stacked segments within each group.
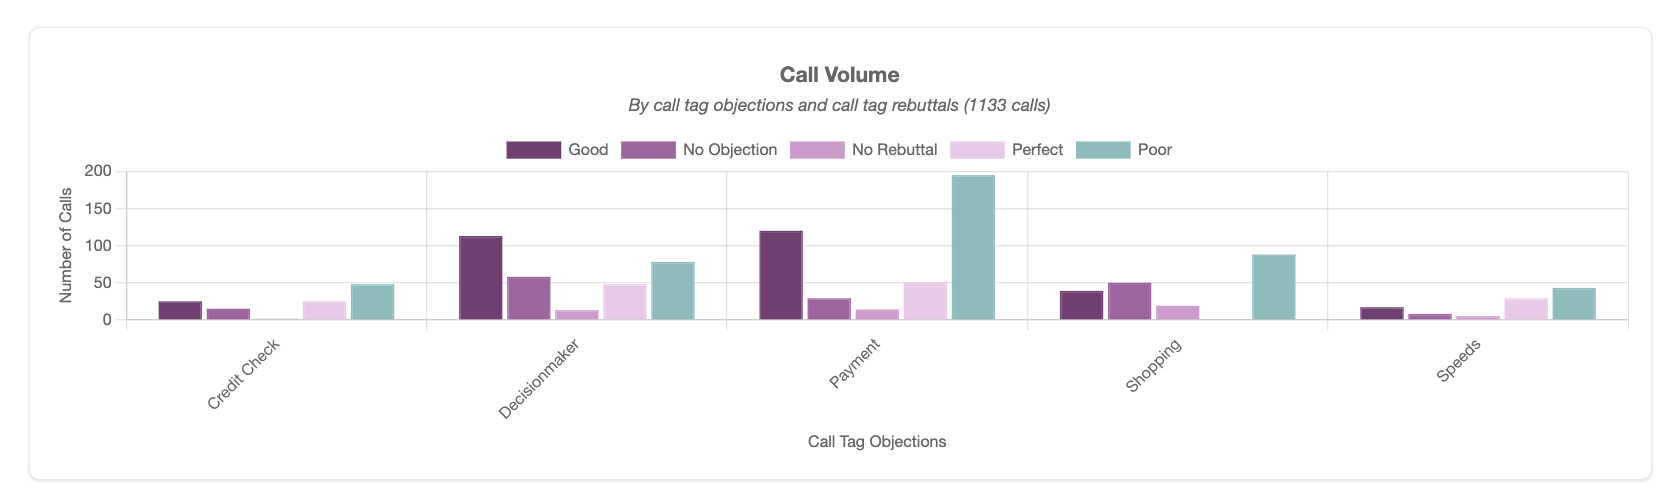
**Example:** The chart and config screenshots above show *Objection type* (Dimension 1) on the axis and *Rebuttal quality* (Dimension 2) as segments. This displays call volume by objection, broken down by rebuttal quality.
For bar charts with two dimensions selected, you can display data either **grouped** (bars side-by-side) or **stacked** (segments stacked on top of each other).
Date breakdowns support configurable intervals: daily, weekly, monthly, or yearly.
Optional widget-specific filters to narrow data within your report scope.
Set a target value or range to display a benchmark line on your chart. Choose between a single target value or a min/max range.
**Widget titles and captions:** Click a widget's title on the canvas to edit it inline. Below each widget, click "Add caption..." to add a short description that appears at the bottom of the visualization.
Generate AI-powered analysis from any prompt. Ask anything -- get patterns, recommendations, and explanations drawn from your call data.
Configure the following fields in the right panel to generate your insight.
Choose from your organization's available metrics (e.g., Call Volume, Average Handle Time, Compliance Score). A description of the selected metric appears below the dropdown to explain what it measures.
Contact your Customer Success Manager to request custom metrics for your organization.
Select a chart type to display the data.
| Chart Type | Best For |
| --------------- | -------------------------------------------------------------------------- |
| Bar Chart | Comparing categories side-by-side |
| Bar Chart Set | Multiple bar charts in a row for comparing the same metric across segments |
| Line Chart | Showing trends over time |
| Area Chart | Showing trends over time with filled regions |
| Card | Highlighting a single key metric |
| Card Set | Displaying multiple key metrics side-by-side |
| Donut/Pie Chart | Displaying proportions of a whole |
| Pie Chart Set | Multiple pie charts in a row for comparing distributions across segments |
| Table | Detailed data with multiple columns |
| List | Ranked items or top performers |
Bar charts support a **horizontal bars** toggle when you want bars displayed left-to-right instead of bottom-to-top.
Choose up to 2 dimensions (e.g., agent, product, tags, date, score range, duration range) to segment data. The first dimension defines the main axis; the second creates grouped or stacked segments within each group.
**Example:** The chart and config screenshots above show *Objection type* (Dimension 1) on the axis and *Rebuttal quality* (Dimension 2) as segments. This displays call volume by objection, broken down by rebuttal quality.
For bar charts with two dimensions selected, you can display data either **grouped** (bars side-by-side) or **stacked** (segments stacked on top of each other).
Date breakdowns support configurable intervals: daily, weekly, monthly, or yearly.
Optional widget-specific filters to narrow data within your report scope.
Set a target value or range to display a benchmark line on your chart. Choose between a single target value or a min/max range.
**Widget titles and captions:** Click a widget's title on the canvas to edit it inline. Below each widget, click "Add caption..." to add a short description that appears at the bottom of the visualization.
Generate AI-powered analysis from any prompt. Ask anything -- get patterns, recommendations, and explanations drawn from your call data.
Configure the following fields in the right panel to generate your insight.
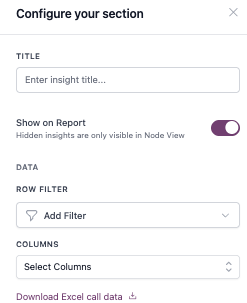
 Enter a descriptive title (e.g., "Who is my best agent?").
* **Row Filter:** Set parameters to specify which calls are pulled into the analysis.
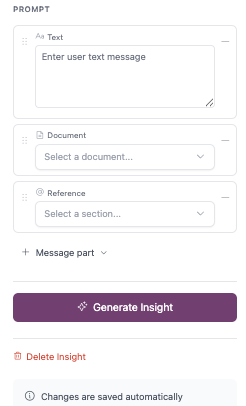
Click **+ Message part** to add inputs. You can add multiple parts and reorder them by dragging:
* **Text:** Your question or prompt
* **Document:** Linked Knowledge Base articles add context
* **Reference:** Other widgets or insights from the same report add context
The more context you provide, the better the results. Referencing other widgets gives the AI access to the data those widgets display, making your analysis richer.
Click **Generate Insight** to run the analysis. You can also click **Generate All Insights** in the top bar to run every insight section at once.
When an insight references other insights, Reddy detects the dependencies and generates them in the correct order. If a referenced insight has not been generated yet, you will be prompted to generate it first.
Insights process large volumes and take 5--60 minutes -- generate before you need them.
After an insight is generated, you can click its content directly on the canvas to make edits. This lets you refine the AI's output -- fix wording, remove sections, or add your own commentary before publishing.
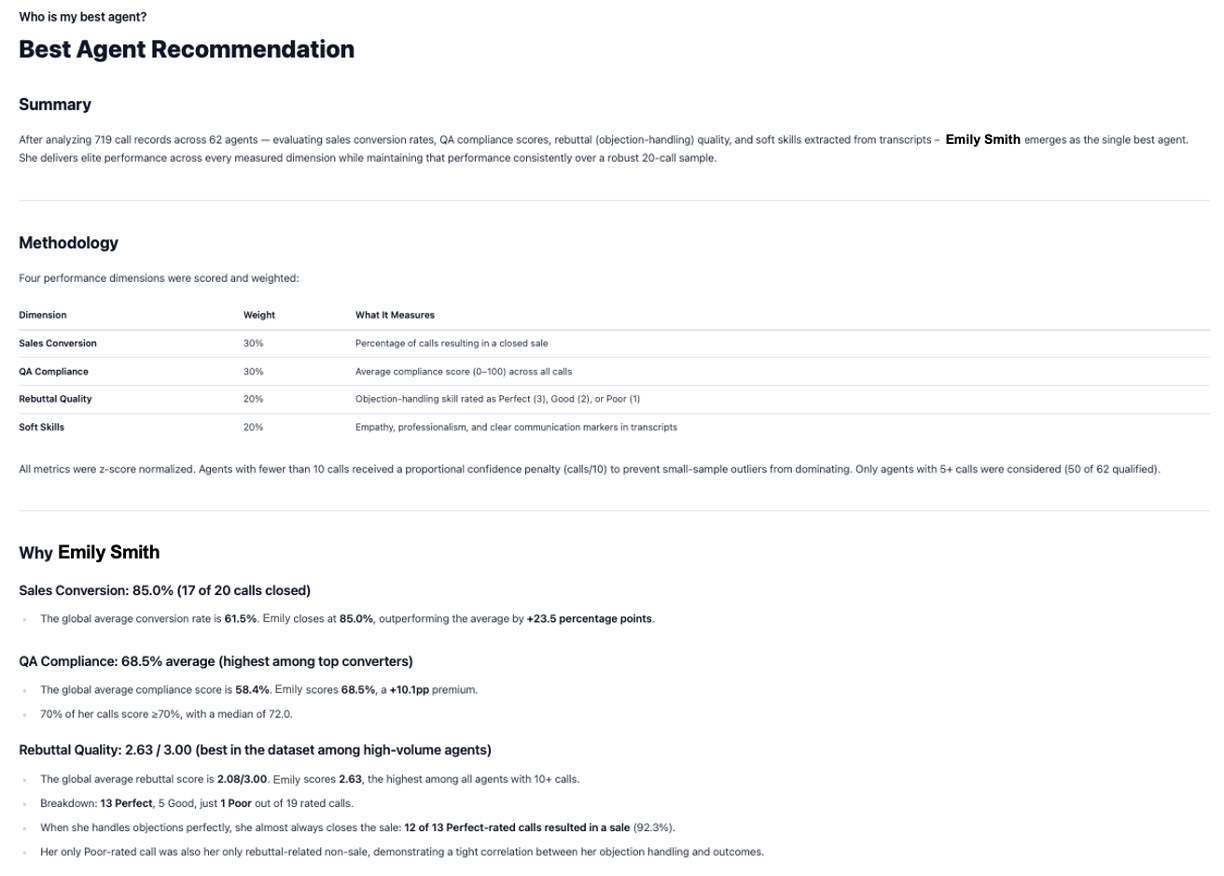
A prompt like *"Looking at our sales conversion numbers, our QA compliance scores, and the soft skills that we train our agents to prioritize -- and then analyzing that across all of the transcripts -- come up with your suggestion on who the single best agent is. Give a data-driven analysis on why you chose that agent."* generates an insight like:
Enter a descriptive title (e.g., "Who is my best agent?").
* **Row Filter:** Set parameters to specify which calls are pulled into the analysis.
Click **+ Message part** to add inputs. You can add multiple parts and reorder them by dragging:
* **Text:** Your question or prompt
* **Document:** Linked Knowledge Base articles add context
* **Reference:** Other widgets or insights from the same report add context
The more context you provide, the better the results. Referencing other widgets gives the AI access to the data those widgets display, making your analysis richer.
Click **Generate Insight** to run the analysis. You can also click **Generate All Insights** in the top bar to run every insight section at once.
When an insight references other insights, Reddy detects the dependencies and generates them in the correct order. If a referenced insight has not been generated yet, you will be prompted to generate it first.
Insights process large volumes and take 5--60 minutes -- generate before you need them.
After an insight is generated, you can click its content directly on the canvas to make edits. This lets you refine the AI's output -- fix wording, remove sections, or add your own commentary before publishing.
A prompt like *"Looking at our sales conversion numbers, our QA compliance scores, and the soft skills that we train our agents to prioritize -- and then analyzing that across all of the transcripts -- come up with your suggestion on who the single best agent is. Give a data-driven analysis on why you chose that agent."* generates an insight like:
 * **Headers:** Editable section titles to organize your report (e.g., "Team Overview," "Individual Performance").
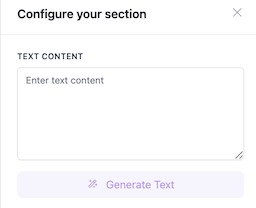
* **Text:** Enter your text directly, or use **Generate Text** to have AI expand and refine it based on what you write.
* **Headers:** Editable section titles to organize your report (e.g., "Team Overview," "Individual Performance").
* **Text:** Enter your text directly, or use **Generate Text** to have AI expand and refine it based on what you write.
 ### Preview mode
For Admin reports, use the **Preview / Edit** toggle to switch between building your report and seeing a read-only preview of how it will look when published.
For Manager and Agent reports, use the employee switcher dropdown to preview how the report looks with different people's data.
### Report name
Click the report name at the top of the canvas to rename it inline.
## Publishing and Sharing
### Publishing
When your report is ready, click **Publish** in the report builder toolbar.
Admin reports publish immediately.
Manager and Agent reports generate in the background -- a separate version is created for each person. You can track progress from the reports list, where the status badge shows "Generating" with a progress count until all versions are complete.
People with no matching data are automatically skipped.
To make changes after publishing, click **Unpublish** to revert the report to draft. The report will no longer be visible to viewers until you publish again.
### Sharing
* **Copy link:** From the reports list, click the ellipsis menu on any report and select **Copy link** to copy a direct link to the report.
* **Share a specific version:** For published Manager and Agent reports, each version has a **Share** button that opens a dialog with a link to that person's report. Copy and send the link -- recipients must be logged in to view it.
## Viewing Published Reports
Click a published Admin report in the reports list to view it. The report opens as a standalone page with interactive charts and formatted insight content.
Click a published Manager or Agent report in the reports list to see the report details page. This page shows:
* **Generation progress** -- While generating, a progress bar shows how many versions have been created (e.g., "12 / 25").
* **Report details** -- Type, creator, creation date, and total number of versions.
* **Search** -- Find a specific person's version by name.
* **Per-version controls** -- Each version can be individually published or unpublished using the toggle in its row. Use the **Share** button to get a direct link, or click **View** to open that person's report.
Managers and agents find reports shared with them under **My Reports** in the left navigation. This page shows only the reports where they have a published version.
Click **View** to open the report. Each report contains only that person's own data -- managers see their team's performance, and agents see their individual performance.
Use the search bar to find a specific report by name.
## Exporting Data
| Export | How to access | What it includes |
| ------------------------ | ------------------------------------------------------------------------------------ | ---------------------------------------------------------------------------------------------- |
| **Widget Excel export** | Click a widget section, then click **Download Excel call data** in the right panel | The underlying call data for that widget, with all filters applied |
| **Insight Excel export** | Click an insight section, then click **Download Excel call data** in the right panel | The call data scoped to that insight's row filters |
| **Export Raw Data** | Available from the company header widget on the canvas | Links to the data export page with the report's date range, products, and duration pre-applied |
| **Print to PDF** | Use your browser's print function (Ctrl+P / Cmd+P) on a published report | A print-optimized version of the report, suitable for saving as PDF |
Excel exports run in the background. A progress indicator appears while the file is being prepared, and the download starts automatically when ready.
## FAQ
It depends on the report type. Admin reports are visible only to admins. Manager and Agent reports are distributed automatically -- each person sees only their own version under **My Reports**. Admins can always view all versions.
Choose the **Manager** or **Agent** report type when creating your report. You design the layout once, and when you publish, each manager or agent receives their own version with their data. They can view it under **My Reports** in the left navigation.
Yes. Unpublish the report to revert it to draft, make your changes, then publish again. While unpublished, the report is not visible to viewers.
Not in a single report -- each report covers either Training or Live calls. Create two separate reports to analyze both.
Yes. Click the ellipsis menu next to any report in the reports list and select **Duplicate**. This creates a copy with the same layout and sections that you can reconfigure with a different date range, product, or report type.
Your organization has a set of pre-configured metrics (e.g., Call Volume, Average Handle Time, Compliance Score). Contact your Customer Success Manager to request additional custom metrics. See the [Metrics Glossary](/manual/reporting-insights/metrics-glossary) for how each metric is calculated.
## Additional Resources
Add custom tags via API for filtering and breakdowns.
How each metric is calculated.
### Preview mode
For Admin reports, use the **Preview / Edit** toggle to switch between building your report and seeing a read-only preview of how it will look when published.
For Manager and Agent reports, use the employee switcher dropdown to preview how the report looks with different people's data.
### Report name
Click the report name at the top of the canvas to rename it inline.
## Publishing and Sharing
### Publishing
When your report is ready, click **Publish** in the report builder toolbar.
Admin reports publish immediately.
Manager and Agent reports generate in the background -- a separate version is created for each person. You can track progress from the reports list, where the status badge shows "Generating" with a progress count until all versions are complete.
People with no matching data are automatically skipped.
To make changes after publishing, click **Unpublish** to revert the report to draft. The report will no longer be visible to viewers until you publish again.
### Sharing
* **Copy link:** From the reports list, click the ellipsis menu on any report and select **Copy link** to copy a direct link to the report.
* **Share a specific version:** For published Manager and Agent reports, each version has a **Share** button that opens a dialog with a link to that person's report. Copy and send the link -- recipients must be logged in to view it.
## Viewing Published Reports
Click a published Admin report in the reports list to view it. The report opens as a standalone page with interactive charts and formatted insight content.
Click a published Manager or Agent report in the reports list to see the report details page. This page shows:
* **Generation progress** -- While generating, a progress bar shows how many versions have been created (e.g., "12 / 25").
* **Report details** -- Type, creator, creation date, and total number of versions.
* **Search** -- Find a specific person's version by name.
* **Per-version controls** -- Each version can be individually published or unpublished using the toggle in its row. Use the **Share** button to get a direct link, or click **View** to open that person's report.
Managers and agents find reports shared with them under **My Reports** in the left navigation. This page shows only the reports where they have a published version.
Click **View** to open the report. Each report contains only that person's own data -- managers see their team's performance, and agents see their individual performance.
Use the search bar to find a specific report by name.
## Exporting Data
| Export | How to access | What it includes |
| ------------------------ | ------------------------------------------------------------------------------------ | ---------------------------------------------------------------------------------------------- |
| **Widget Excel export** | Click a widget section, then click **Download Excel call data** in the right panel | The underlying call data for that widget, with all filters applied |
| **Insight Excel export** | Click an insight section, then click **Download Excel call data** in the right panel | The call data scoped to that insight's row filters |
| **Export Raw Data** | Available from the company header widget on the canvas | Links to the data export page with the report's date range, products, and duration pre-applied |
| **Print to PDF** | Use your browser's print function (Ctrl+P / Cmd+P) on a published report | A print-optimized version of the report, suitable for saving as PDF |
Excel exports run in the background. A progress indicator appears while the file is being prepared, and the download starts automatically when ready.
## FAQ
It depends on the report type. Admin reports are visible only to admins. Manager and Agent reports are distributed automatically -- each person sees only their own version under **My Reports**. Admins can always view all versions.
Choose the **Manager** or **Agent** report type when creating your report. You design the layout once, and when you publish, each manager or agent receives their own version with their data. They can view it under **My Reports** in the left navigation.
Yes. Unpublish the report to revert it to draft, make your changes, then publish again. While unpublished, the report is not visible to viewers.
Not in a single report -- each report covers either Training or Live calls. Create two separate reports to analyze both.
Yes. Click the ellipsis menu next to any report in the reports list and select **Duplicate**. This creates a copy with the same layout and sections that you can reconfigure with a different date range, product, or report type.
Your organization has a set of pre-configured metrics (e.g., Call Volume, Average Handle Time, Compliance Score). Contact your Customer Success Manager to request additional custom metrics. See the [Metrics Glossary](/manual/reporting-insights/metrics-glossary) for how each metric is calculated.
## Additional Resources
Add custom tags via API for filtering and breakdowns.
How each metric is calculated.