> ## Documentation Index
> Fetch the complete documentation index at: https://docs.reddy.io/llms.txt
> Use this file to discover all available pages before exploring further.
# API Logs & Monitoring
> Monitor your API requests with the Developer API tool
## Overview
The Developer API tool provides visibility into your API requests, helping you debug and resolve integration issues quickly. Access the API monitoring dashboard in your [Settings > Developer](https://app.reddy.io/dashboard/settings/#developer) tab.
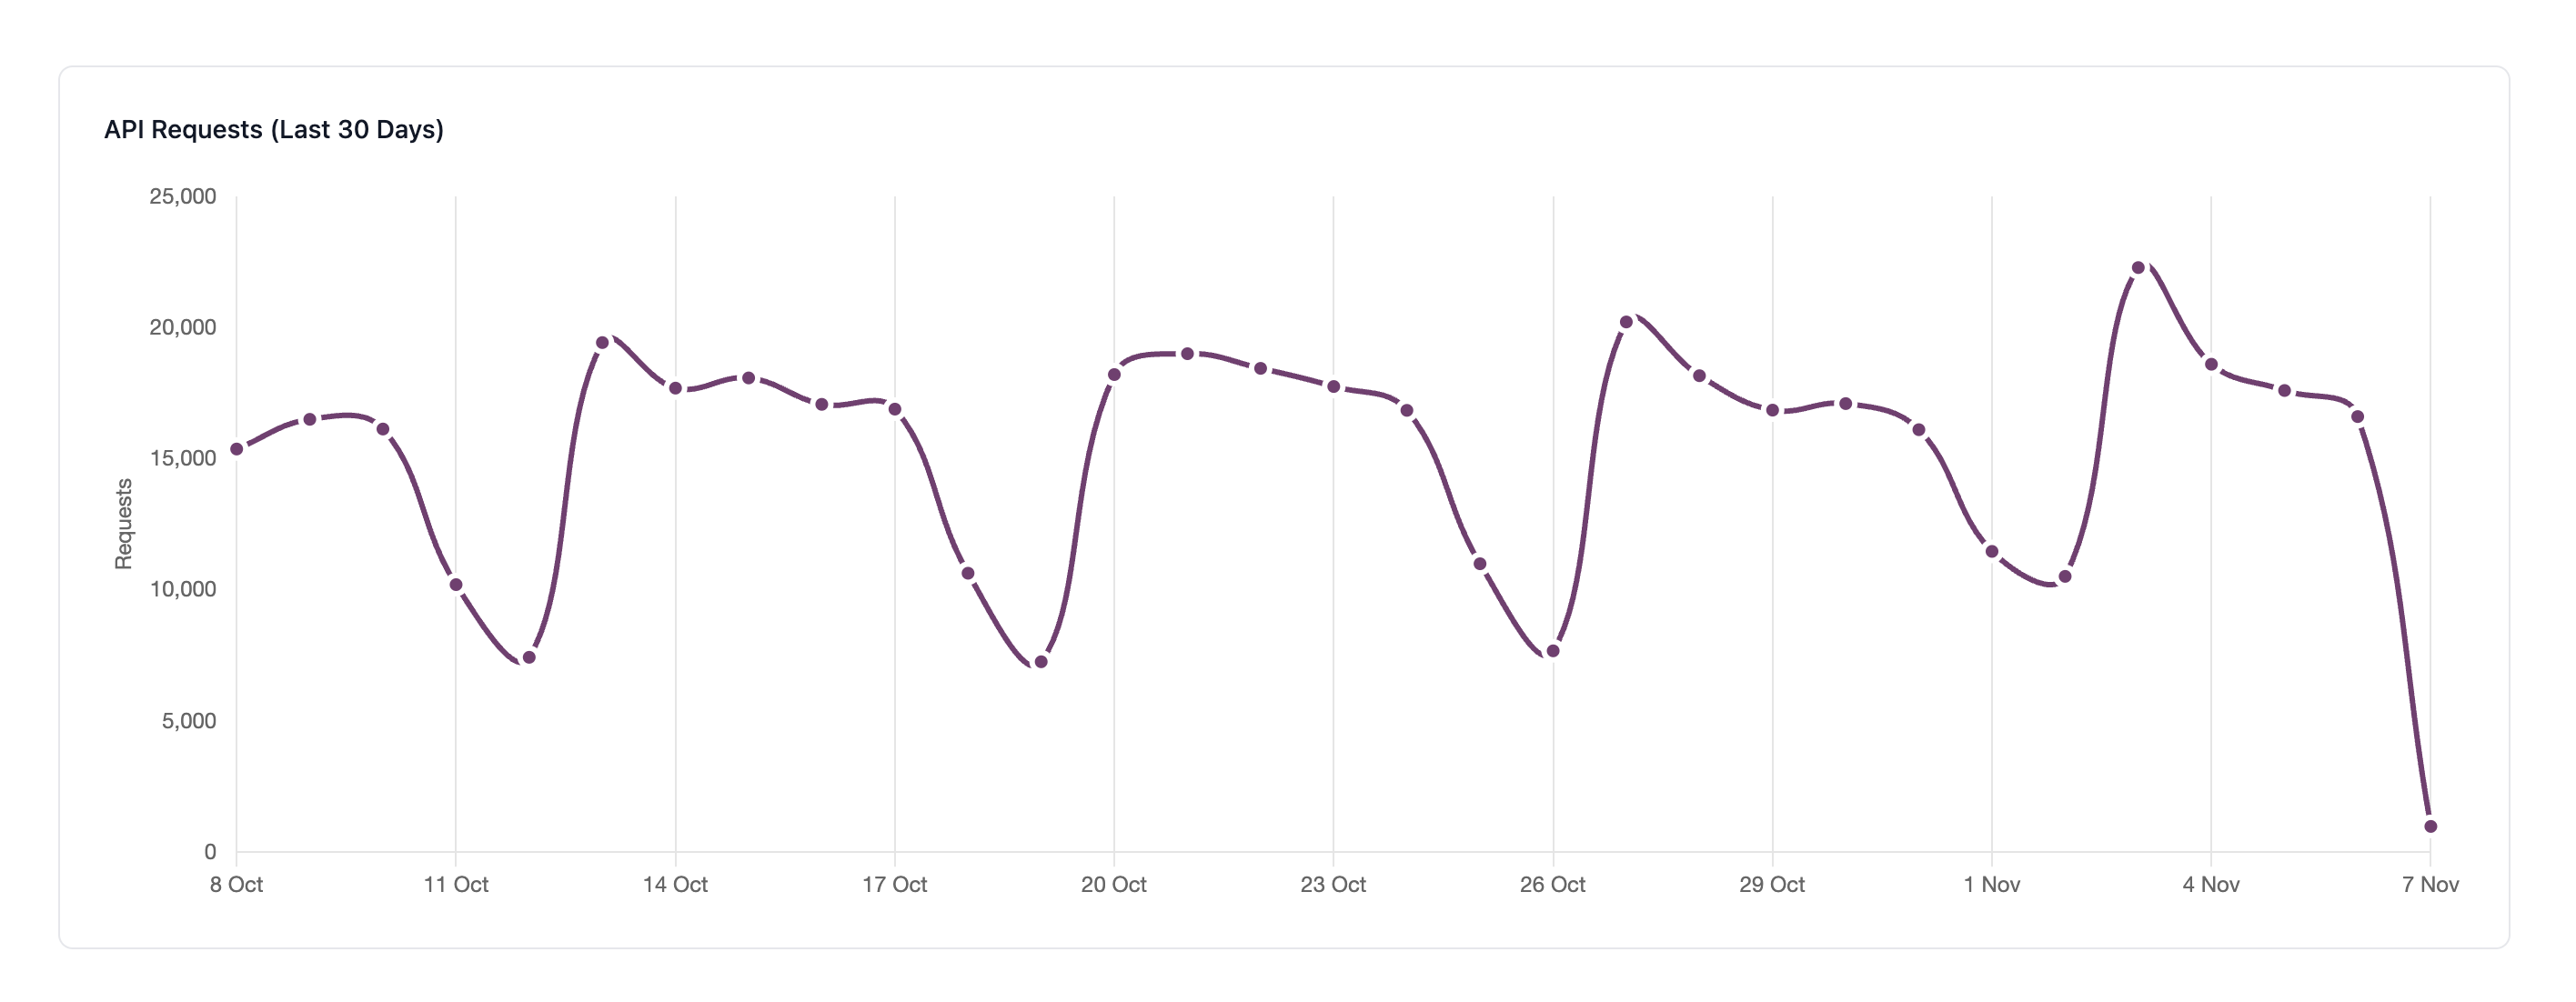
At the top you'll see an overview of your API request volume over the last 30 days:
 ## API Request Logs
This is a log of your API requests from the last 30 days. The logs display up to 100 of your most recent requests that match the filter and search options you've selected. Reach out to Reddy Support if you need access to API logs older than 30 days.
### Log Information
Each log entry includes:
* **Timestamp**: When the request was made (format: `YYYY-MM-DD HH:MM:SS`)
* **Method**: HTTP method used (`GET`, `POST`, `PUT`, `DELETE`)
* **Endpoint**: The API endpoint path (e.g., `/api/v1/conversations`)
* **Status**: HTTP response status code (e.g., `200`, `201`, `404`, `422`)
* **Response Time**: Request duration in milliseconds (e.g., `127.37ms`)
The human readable timestamps shown on each record are in your configured timezone. Change it in [Settings > General > Current Timezone](https://app.reddy.io/dashboard/settings/#general).
### Viewing Request Details
Click on any log entry to go to the expanded view with full request and response details, including any error messages (if applicable).
## Live Monitoring
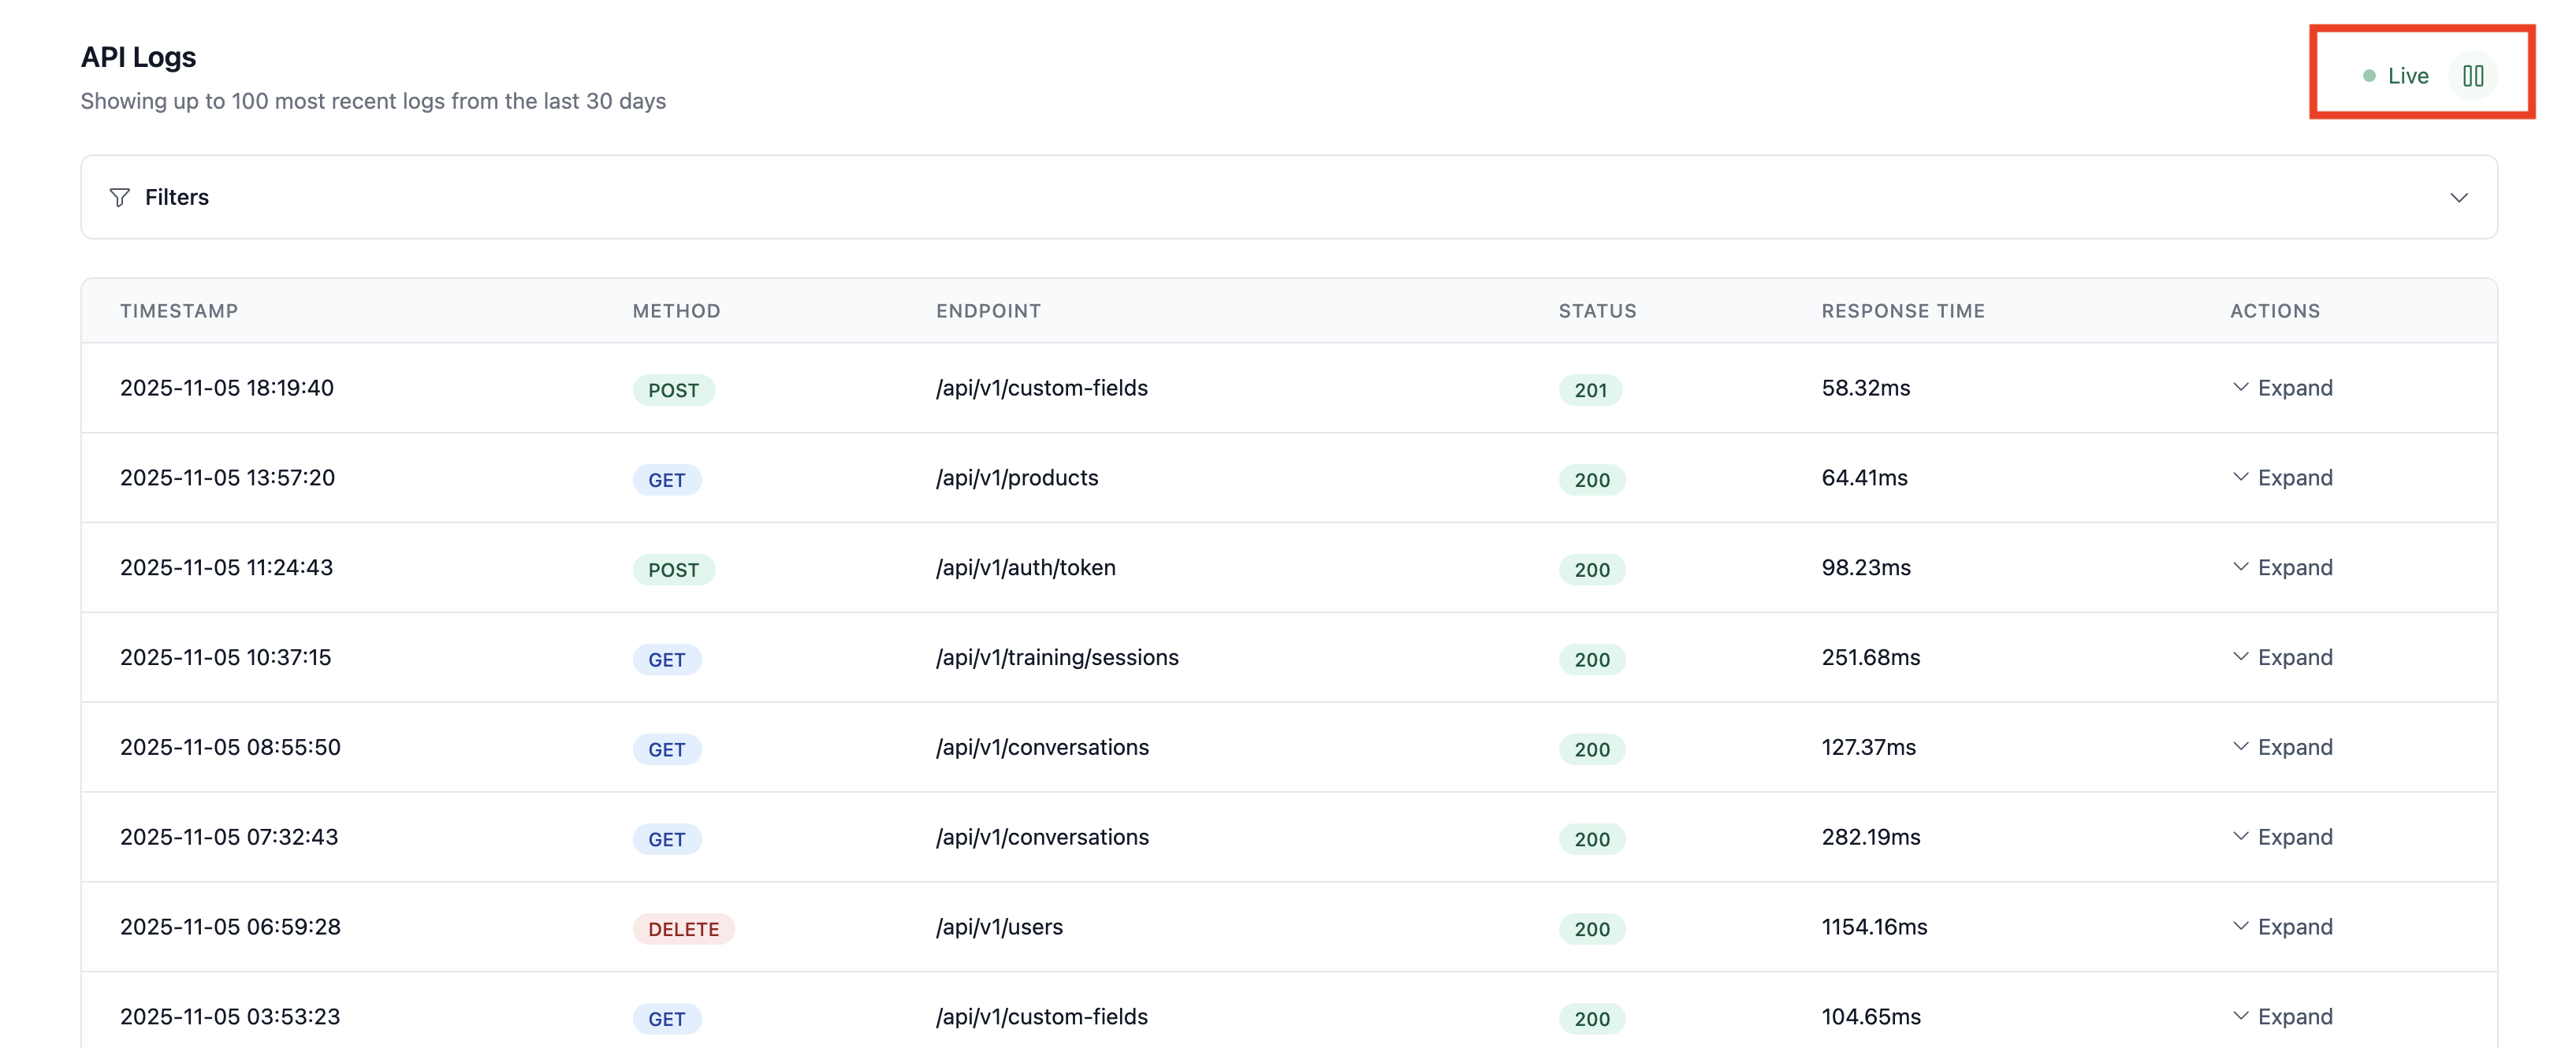
The API logs update in real-time with a **Live** indicator showing active monitoring. Click the pause button to toggle this off if you want to freeze the current table:
## API Request Logs
This is a log of your API requests from the last 30 days. The logs display up to 100 of your most recent requests that match the filter and search options you've selected. Reach out to Reddy Support if you need access to API logs older than 30 days.
### Log Information
Each log entry includes:
* **Timestamp**: When the request was made (format: `YYYY-MM-DD HH:MM:SS`)
* **Method**: HTTP method used (`GET`, `POST`, `PUT`, `DELETE`)
* **Endpoint**: The API endpoint path (e.g., `/api/v1/conversations`)
* **Status**: HTTP response status code (e.g., `200`, `201`, `404`, `422`)
* **Response Time**: Request duration in milliseconds (e.g., `127.37ms`)
The human readable timestamps shown on each record are in your configured timezone. Change it in [Settings > General > Current Timezone](https://app.reddy.io/dashboard/settings/#general).
### Viewing Request Details
Click on any log entry to go to the expanded view with full request and response details, including any error messages (if applicable).
## Live Monitoring
The API logs update in real-time with a **Live** indicator showing active monitoring. Click the pause button to toggle this off if you want to freeze the current table:
 ## Filtering Logs
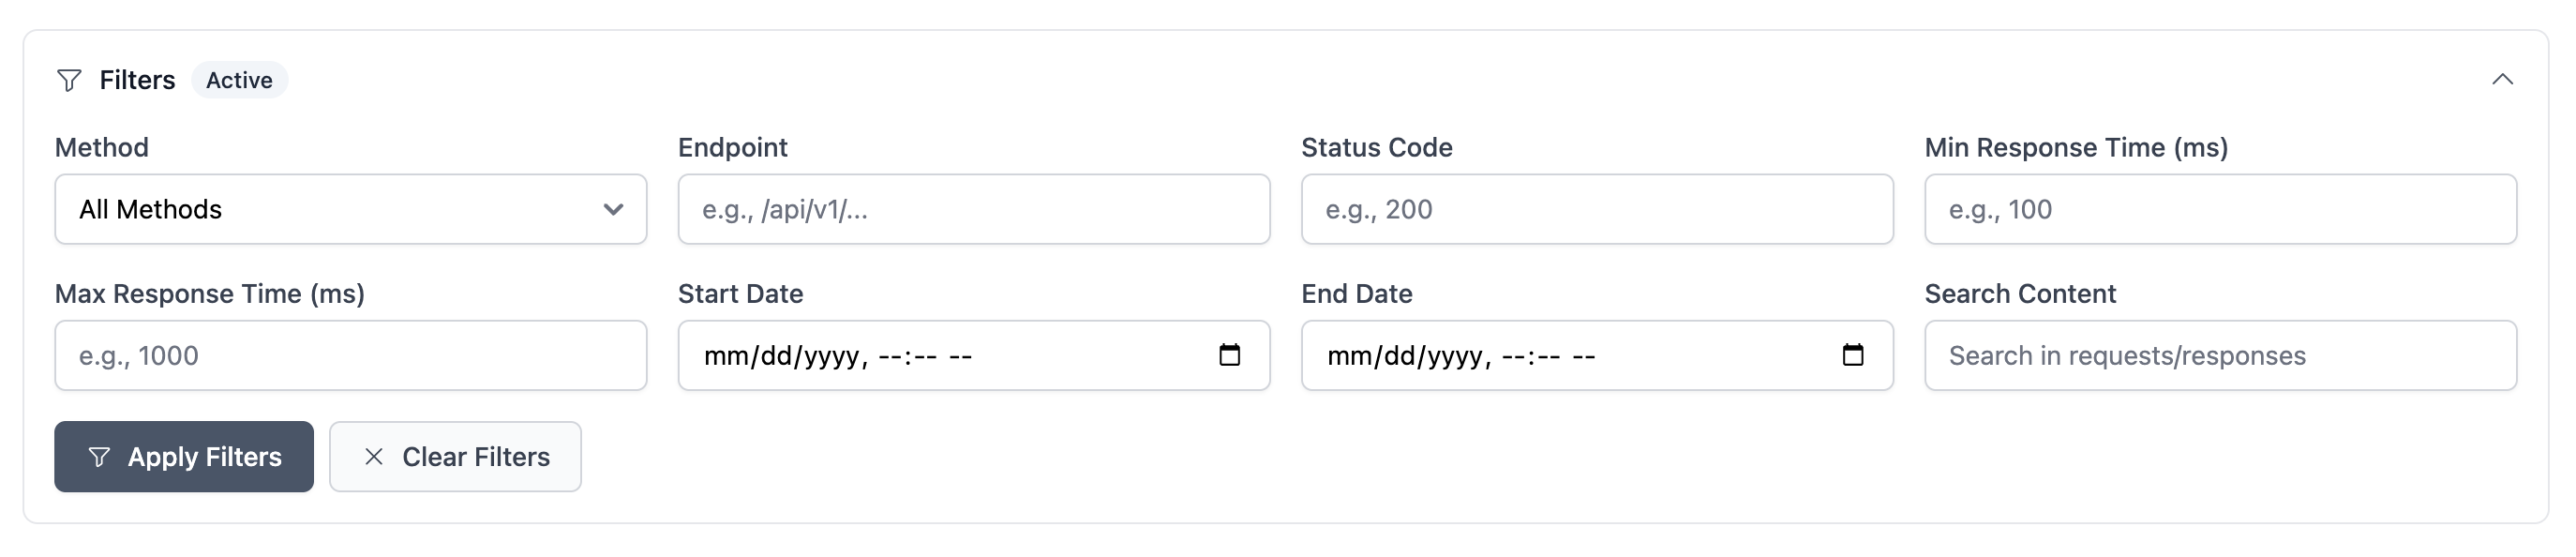
Use the filters panel to narrow down your logs by status code, endpoint, request body, etc. Note that the start and end date ranges are for the time the API request was received, *not* the timestamp in the request body (e.g., for the /call/create endpoint).
## Filtering Logs
Use the filters panel to narrow down your logs by status code, endpoint, request body, etc. Note that the start and end date ranges are for the time the API request was received, *not* the timestamp in the request body (e.g., for the /call/create endpoint).
 ## Common Status Codes
| Status Code | Meaning |
| ----------------------------------------------------------------------------- | ------------------------------------------------------------------------- |
| [**200**](https://app.reddy.io/dashboard/settings/?status_code=200#developer) | Success - Request completed successfully |
| [**401**](https://app.reddy.io/dashboard/settings/?status_code=401#developer) | Unauthorized - Invalid or missing API key |
| [**404**](https://app.reddy.io/dashboard/settings/?status_code=404#developer) | Not Found - Endpoint or resource doesn't exist |
| [**422**](https://app.reddy.io/dashboard/settings/?status_code=422#developer) | Validation Error - Request payload failed validation |
| [**429**](https://app.reddy.io/dashboard/settings/?status_code=429#developer) | Rate Limited - Too many requests (see [Rate Limits](/guides/rate_limits)) |
## Quick Links
Regularly check for 404 status codes to identify issues early.
Monitor for 429 responses and adjust your retry strategy if needed.
## Need Help?
If you're experiencing persistent issues or need assistance interpreting your API logs, reach out to your Reddy Support Manager.
## Common Status Codes
| Status Code | Meaning |
| ----------------------------------------------------------------------------- | ------------------------------------------------------------------------- |
| [**200**](https://app.reddy.io/dashboard/settings/?status_code=200#developer) | Success - Request completed successfully |
| [**401**](https://app.reddy.io/dashboard/settings/?status_code=401#developer) | Unauthorized - Invalid or missing API key |
| [**404**](https://app.reddy.io/dashboard/settings/?status_code=404#developer) | Not Found - Endpoint or resource doesn't exist |
| [**422**](https://app.reddy.io/dashboard/settings/?status_code=422#developer) | Validation Error - Request payload failed validation |
| [**429**](https://app.reddy.io/dashboard/settings/?status_code=429#developer) | Rate Limited - Too many requests (see [Rate Limits](/guides/rate_limits)) |
## Quick Links
Regularly check for 404 status codes to identify issues early.
Monitor for 429 responses and adjust your retry strategy if needed.
## Need Help?
If you're experiencing persistent issues or need assistance interpreting your API logs, reach out to your Reddy Support Manager.